

october 2026Who does it best?
THE Leafe Food Hygiene data report 2026
Discover how venues are performing in your industry and how you can keep your food hygiene score squeaky cleanWelcome to Leafe. We are the food hygiene app helping customers ditch their paperwork and keep compliant records without the usual fuss.
The Leafe Food Hygiene Review 2026 evaluates which food industries are keeping up the highest standards this year, and highlights the best-performing sectors in the UK.
This report investigates the Food Standards Agency (FSA) hygiene ranking data for more than 500,000 business across Scotland, England and Wales.
In the UK, firms in England, Wales and Northern Ireland are awarded a Food Hygiene Rating Scheme (FHRS) score on a scale from 0 (urgent improvement needed) to 5 (very good). In Scotland, businesses are given a simple ‘pass or fail-style’ rating from the Food Hygiene Information Scheme (FHIS), with compliant businesses being awarded a Pass and ones that fall short being given an Improvement Required rating. The variation in the hygiene rating system means that direct comparisons between the datasets between nations cannot be made, but where possible also compares the hygiene performance of the Scottish food industry against the rest of the UK.
In Wales and Northern Ireland, it is legally required to display your FHRS rating, meaning that a poor score could result in a major deterrent for customers - which is why maintaining an organised and compliant business is so vital. In England and Scotland, it is not mandatory to display your rating, but all FHRS and FHIS records are publicly available and a poor score often results in negative publicity and further Environmental Health Officer (EHO) inspections.
This is why tools like the Leafe app can make such a huge difference for businesses across the whole of the UK. Navigating food hygiene legal compliance requirements with paper records in an already hectic kitchen is an additional stress that food business no longer need to put up with in the modern age. Leafe is EHO-approved, allowing businesses to keep compliant hygiene records while also managing their inventory, allergens and staff checklists.
This report evaluates the most recent FSA data on a sector-by-sector basis, highlighting the strongest performing industries and those most in need of improvement.
Key measures and metrics
A number of metrics are used in this report to assess the food hygiene standards in each sector.
These are:
The average rating of a sector’s business on the FHRS (0-5) scale
The percentage of a sector’s businesses rated either 0 or 1 by the FHRS
The percentage of a sector’s businesses rated 5 by the FHRS
The percentage of a sector’s businesses rated IMPROVEMENTS REQUIRED by the FHIS
The percentage of a sector’s businesses rated PASS by the FHIS
Scotland’s performance compared with the rest of the UK (rUK) is measured by a comparison between the percentage of each sector’s businesses rated as IMPROVEMENTS REQUIRED in Scotland with those rated between 0 and 2 in England, Wales and Northern Ireland
FSA data is divided into 14 different sector categories:
Distributors/transporters
Farmers/growers
Hospitals/Childcare/Care premises
Hotel/B&B/Guesthouse
Importers/exporters
Manufacturers/packers
Mobile caterer
Other catering premises
Pub/bar/nightclub
Restaurant/café/canteen
Retailers - other
Retailers - super/hypermarket
School/college/university
Takeaway/sandwich shop

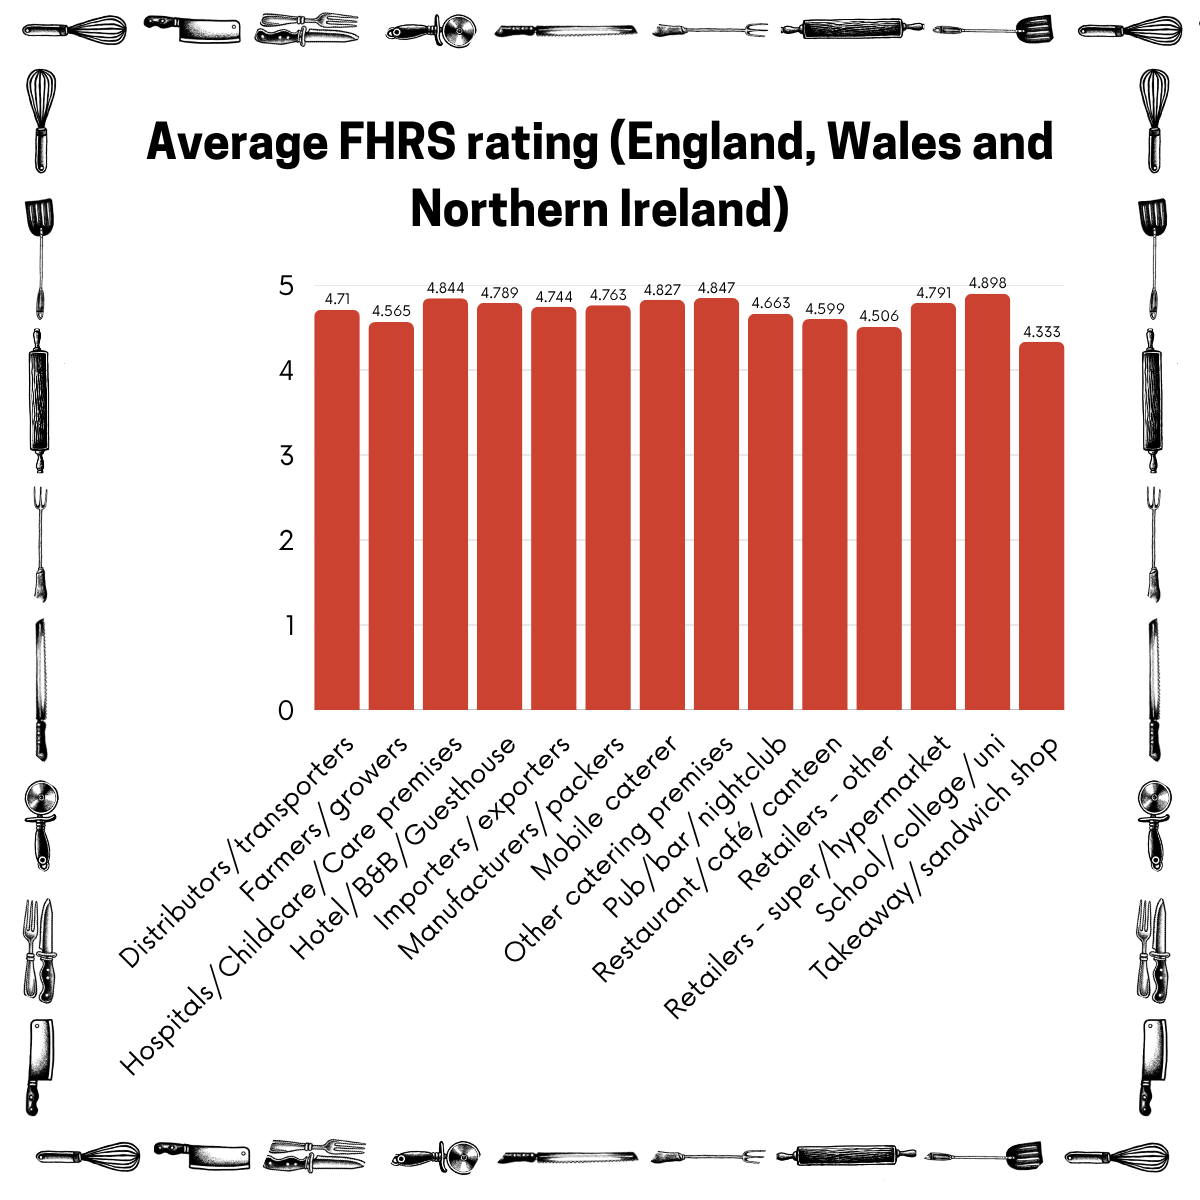
Schools, colleges and universities came out on top of the overall average rankings with a score of 4.898, while takeaways and sandwich shops have had the weakest hygiene performance with a score of just 4.333 on average.
Hospitals, childcare and care premises also had a strong average rating of 4.844, offering comfort to parents and families that their relatives are safely catered for both in education and medical care.
key FINDINGS and ANALYSIS
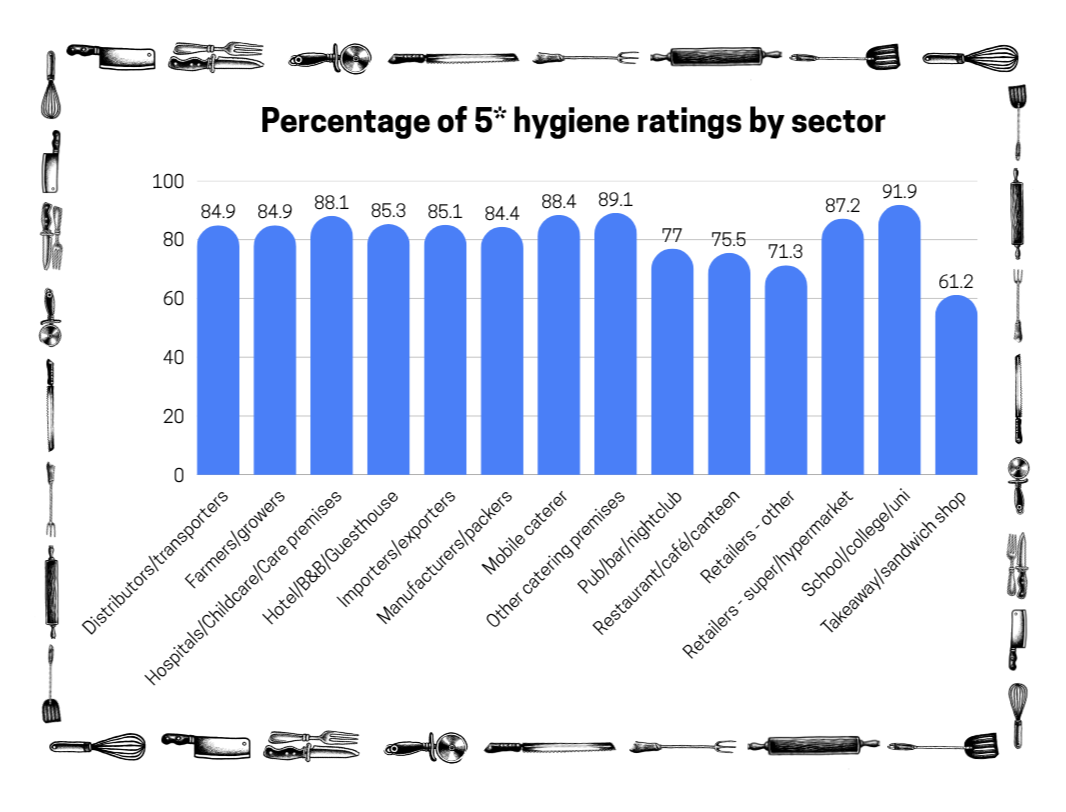
Schools, colleges and universities continue their strong performance with 91.9% achieving the maximum rating of 5.
Just 61.2% of takeaways and sandwich shops received a score of 5. This was a full 10 percentage points behind the second lowest performing category, other retailers (which includes local newsagents and small shops), at 71.3%
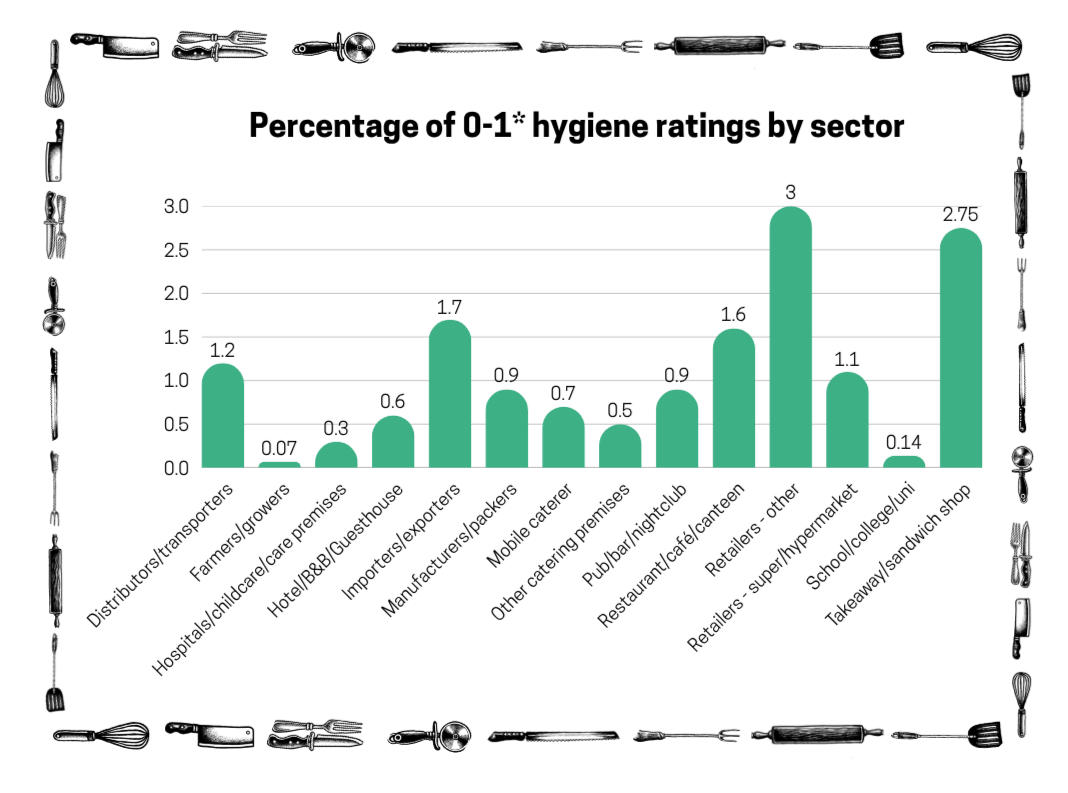
A key point of concern is that other retailers and takeaways and sandwich shops also had the highest number of 0 and 1 scores of any sector at 3% and 2.75% respectively.
Farmers and growers were the standout in this category, with just 0.07% - less than 1 in every 10,000 - receiving a score of 0 or 1.

Comparing england, wales and northern ireland’s food hygiene with scotland’s
Due to the differing systems either side of the border between England and Scotland, this study compares the ratings in Scotland and those in the rest of the UK (rUK) to evaluate how Scotland stacks up against rUK as well as any significant differences between the results.
In rUK, any business receiving a score below 3 (Generally Satisfactory) is considered to be in need of some level of improvement. Therefore, average scores between 0 and 2 have been measured against the figures for the Scottish standard of Improvement Required.
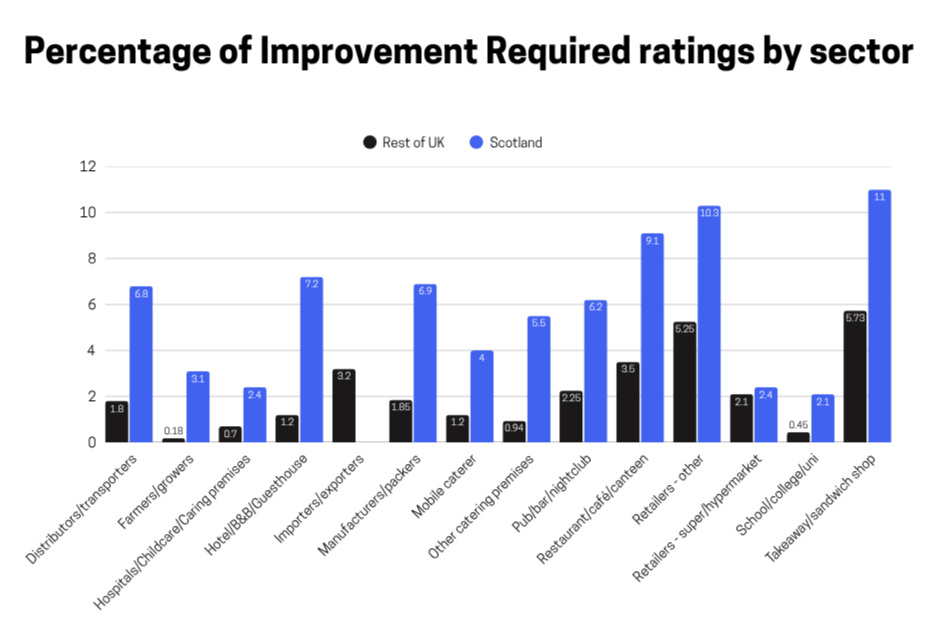
Scotland had a significantly higher proportion of Improvement Required ratings as compared with those rated between 0 and 2 in rUK, with the Scottish figures being an average of 3.4 times higher than those in rUK (after removing anomalous results). Trends in sectors, however, remained consistent when comparing Scotland’s data with rUK, suggesting the higher figures could be due to more stringent standards under the FHIS system than under the FHRS rather than a generally poorer hygiene performance in the country. Nevertheless, the figures may be somewhat alarming to consumers. Notable statistics include:
11% of all takeaways and sandwich shops in Scotland received an Improvement Required rating.
That was closely followed by 10.3% of businesses in the ‘retailers - other’ category (most often made up of newsagents and corner shops with food hygiene requirements).
Restaurants, cafés and canteens also received a high number of Improvement Required ratings, with almost 1 in 10 (9.1%) being awarded such a rating, as compared with 3.5% in rUK.
The biggest difference came in the ‘farmers/growers’ category, where 3.1% required improvement in Scotland, 17 times higher than the 0.18% in rUK.
An outlier was in the ‘importers/exporters’ category, which received a spotless record in Scotland with no Improvement Required ratings whatsoever, whereas 3.2% required improvement in rUK.

Methodology
This report was compiled using data from the UK Government’s Food Standards Agency, downloaded in September 2026.
The focus of this study was to compare the food hygiene performance of different sectors of the UK. Therefore, all 14 business categories designated by the FSA were included in the analysis. When calculating average scores and percentages, exempt businesses and those awaiting inspection were removed from consideration - as well as any anomalous results.
As detailed above, the metrics utilised to compare performance were as follows:
The average rating of a sector’s business on the FHRS (0-5) scale
The percentage of a sector’s businesses rated either 0 or 1 by the FHRS
The percentage of a sector’s businesses rated 5 by the FHRS
The percentage of a sector’s businesses rated IMPROVEMENTS REQUIRED by the FHIS
The percentage of a sector’s businesses rated PASS by the FHIS
Scotland’s performance compared with the rest of the UK (rUK) is measured by a comparison between the percentage of each sector’s businesses rated as IMPROVEMENTS REQUIRED in Scotland with those rated between 0 and 2 in England, Wales and Northern Ireland
Food Standards Agency food hygiene ratings information is subject to the terms of the Open Government Licence (OGL).